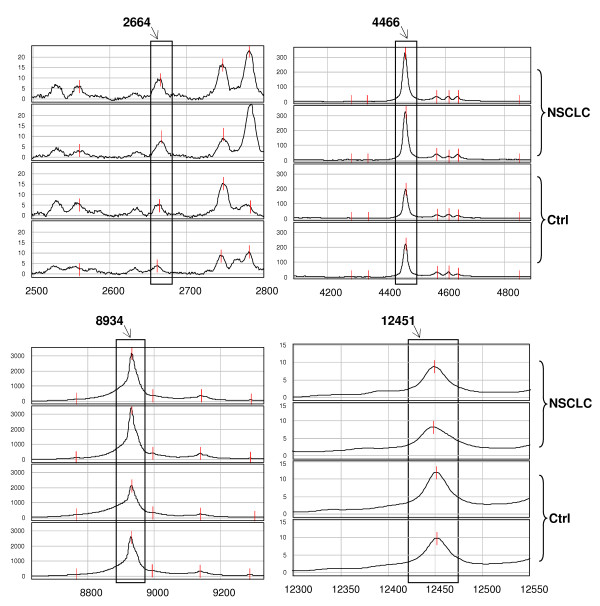
Figure 2.
Serum protein profile of low-MW predictor peaks (IMAC30-Cu). Representative spectra (in duplicate) obtained by SELDI-ToF-MS analysis concerning the 4 statistically significant peaks detected with IMAC30-Cu and used as predictors to build the decision classification tree shown in Figure 1. The peaks of interest are highlighted in rectangles and their m/z values are reported above. (Ctrl = control subjects).

