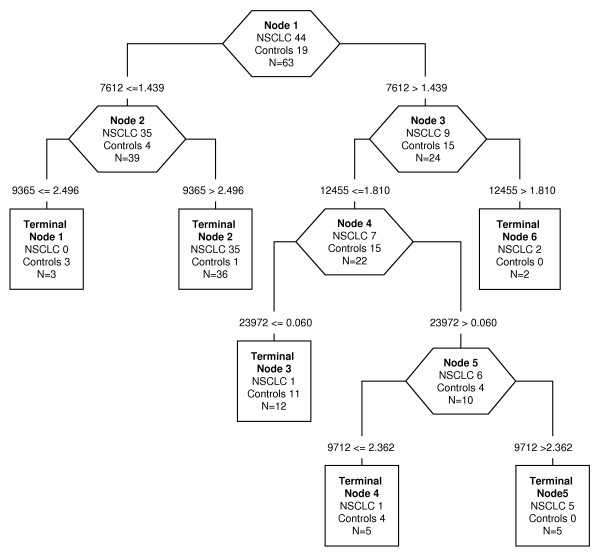
Figure 4.
Decision tree classification diagram of low-MW protein peaks from NSCLC patients and controls, using H50 conditions. The numbers in the root (top), descendant nodes (exagons) and terminal nodes (rectangles), represent the classes (NSCLC patients and controls, N = sum of NSCLC and controls). The numbers below the root and descendant nodes indicate the values of mass peak and its intensity, respectively.

