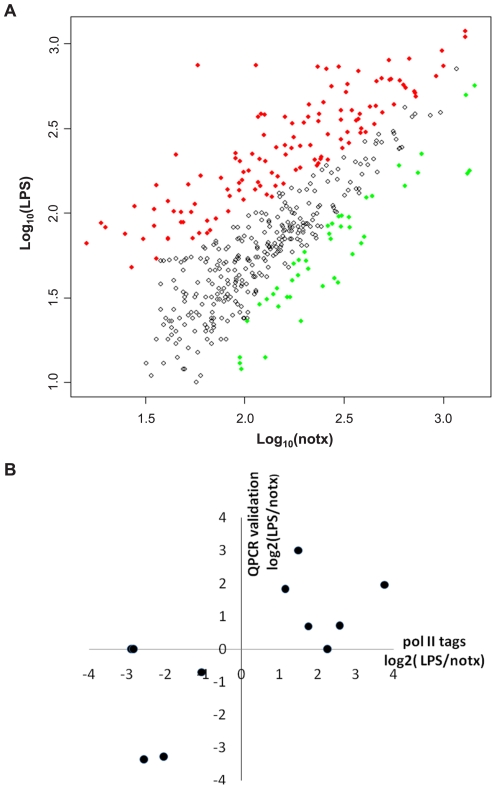
Figure 4. Effect of LPS on lincRNAs.
A: differentially regulated lincRNAs by LPS. Due to the difference in tags between the LPS vs. no-treatment conditions, tag counts under the no-treatment condition are first normalized by a linear regression, and then tested for difference as described in Methods. Data plotted are the log10 transformation of the original tag counts in LPS treatment vs. the log10 transformation of the original tag counts in LPS treatment. Red data points (126) denote up-regulation and green data points (45) denote down-regulation. B: experimental validation of 11 lincRNAs. Data are plotted as log2 transformation of fold change on predicted exons by QPCR experiments vs. log2 transformation of fold change in Pol II tag counts by QPCR experiments. The lincRNAs that are under-detectable in QPCR are assigned to have y-values of 0.

