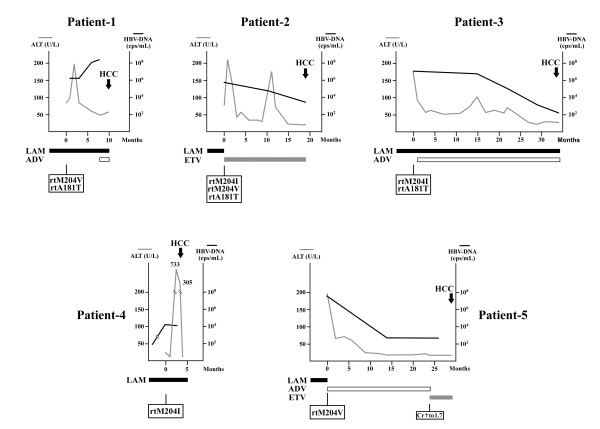
Figure 3.
Clinical courses of 5 HCC patients from entry to the study to development of HCC. The changes of ALT level (gray lines) and HBV-DNA level (black line) were depicted. Arrow, time-point of HCC diagnosis; Solid bar, duration of LAM used; Shaded bar, duration of ETV used; Empty bar, duration of ADV used.

