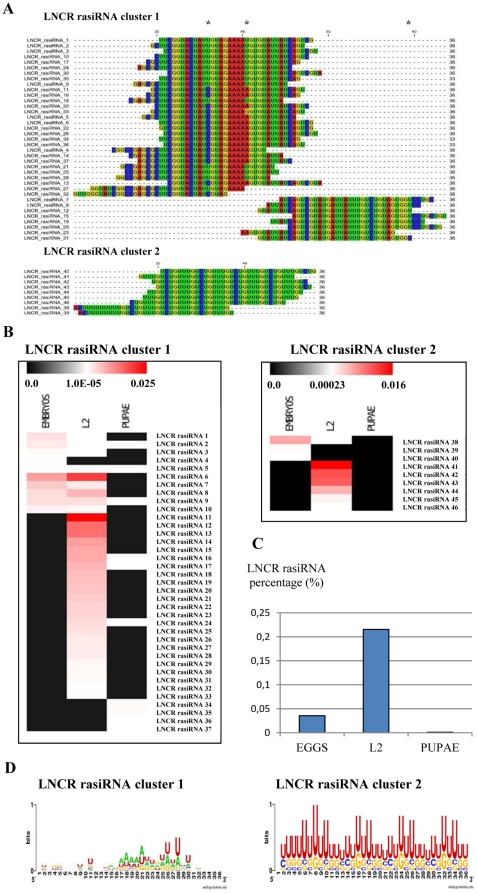
Figure 2. LNCR rasiRNAs expression during different developmental stages of S. frugiperda.
A) Alignment of LNCR rasiRNA sequences organised in two clusters by CLC Sequence Viewer 6.3 software. All the LNCR rasiRNA sequences are acquired from Illumina sequencing. Asterisks are pointing imperfect matches. B) Expression heat map of LNCR rasiRNAs acquired by Illumina sequencing of three S. frugiperda libraries (eggs, L2 and pupae). The normalized copy number of each LNCR rasiRNA sequence is presented using color bar at the top of each image which presents scale of percentage of LNCR rasiRNAs sequenced copies over the total number of sequenced small RNAs in each library (see Table S3 for the exact numbers). The LNCR rasiRNA abundance is positively correlated with the red color intensity. C) Percentage of total LNCR rasiRNA sequenced copies found at each developmental stage of S. frugiperda over the total number of sequenced small RNAs in each library acquired from Illumina sequencing of three developmental libraries (see also Table S3). D) A nucleotide composition of S. frugiperda LNCR rasiRNAs from both clusters (weblogo.berkeley.edu).

