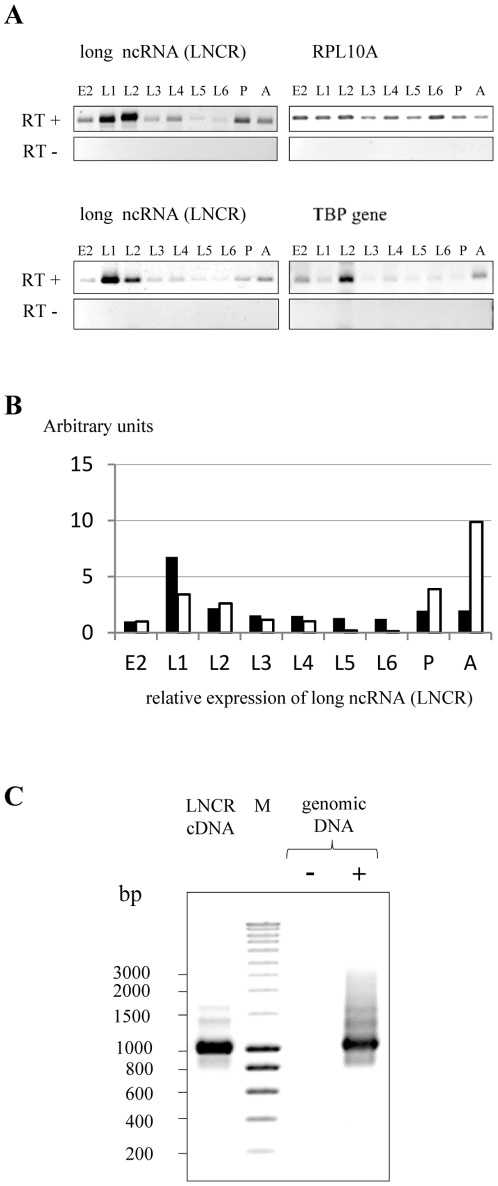
Figure 3. Expression analysis of S. frugiperda long ncRNA (LNCR) during different developmental stages.
A) Expression analysis of S. frugiperda long ncRNA (LNCR) during different developmental stages (E2- 2.5 days old fertilised eggs, L1–L6 larval stages, P- 12-day old pupae and A- adults) by semi quantitative RT PCR. PCR was done on total RNA treated with reverse transcriptase (RT+) or without it (RT−). Expressions of ribosomal gene RPL10A and TBP (TATA binding protein) were used as endogenous control genes. PCR was done with primers amplifying the LNCR region from 27–1271 (upper panel) and LNCR region from 858–1271 nt (lower panel). B) Graph presenting the normalized quantity of expressed LNCR relative to the expression of endogenous control genes: ribosomal gene RPL10A (white bars) and transcription factor TBP (black bars). The quantification was done with ImageQuant TL software. C) PCR done on S. frugiperda genomic DNA with the same pair of primers (pair of primers amplifying the LNCR region from 27–1271 nt) used for expression analysis of LNCR by semi quantitative RT PCR. M indicates DNA ladder and molecular sizes (in base pairs) are shown on the left of the figure.

