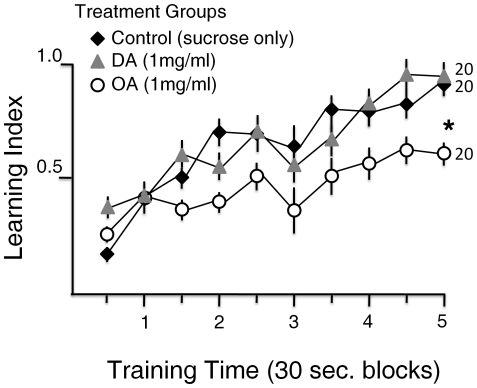
Figure 3. Avoidance conditioning learning curves.
Bees in the principal treatment groups (control, OA, and DA) all showed increase in learning index over time (Repeated measures MANOVA, time −10 blocks-: F = 13. 25; df = 9; P<0.001). OA group bees showed a significantly slower increase and reached a lower maximum learning index (Repeated measures MANOVA, groups (3): F = 4.06, df = 2, P<0.025).

