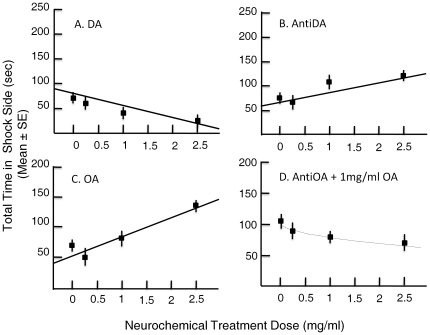
Figure 5. Dose responses for total punishment (shock) time during avoidance conditioning.
A. DA dose response. A linear fit (y = 78.152−23.226x; r = 0.45; n = 35, P<0.01 where y = punishment time in sec. and x = dose in mg/ml) shows increasing dose of DA to lead to reduced punishment time during avoidance conditioning. B. Pimozide dose response. A linear fit (y = 67.784+19.606x; r = 0.39; n = 43, P = 0.01) shows increasing dose of Pimozide to lead to increased punishment time during avoidance conditioning. C. OA dose response. A linear fit (y = 57.472+30.169x; r = 0.52, n = 40, P<0.01) shows increasing dose of OA to lead to increased punishment time during avoidance conditioning. D. Mianserin dose response. In the case of mianserin, only the square root fit (y = 102.167−23.172x1/2; r = 0.31, n = 50, P<0.05) was statistically significant, indicating a potential titration of OA effect beyond the 1 mg/ml mianserin dose.

