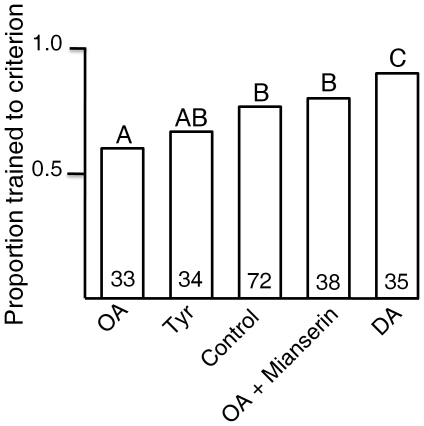
Figure 6. Training to criterion of complete avoidance.
Proportion of bees trained to complete avoidance across treatment groups (control, OA, DA, TYR, and OA+ Mianserin) differed significantly (Likelihood ratio test: X2 = 13.458, df = 4, P<0.01). The numbers in the bars indicate the number of individuals in each group. The bars with different letters are statistically significantly different (P<0.05) from each other in multiple comparisons.

