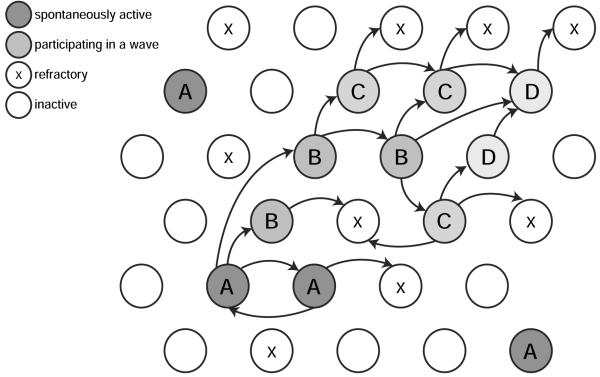
Figure 1.
Schematic of wave generation. Each circle represents an individual neuron. At any time a neuron is quiet, firing or refractory. Individual neurons may fire spontaneously independent of each other (neurons marked A); co-activation of e.g. two neighboring neurons, as at the bottom, may be sufficient to cause a wave to propagate to neighboring regions (A → B → C → D). The wave stops when it can no longer recruit neurons that are still in their refractory period (marked with x).

