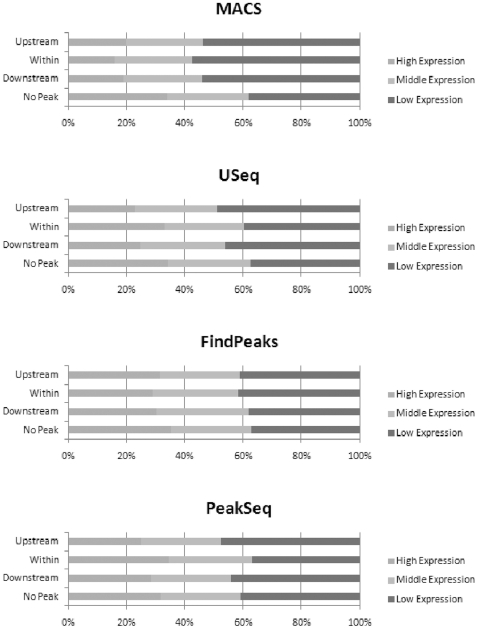
Figure 3. Conditional probabilities of gene expression versus peak classification.
This figure illustrates the conditional probabilities of gene expression versus peak classification for each of the four peak identification programs. For example, the top bar for MACS indicates that approximately 20% of the genes with a peak upstream had high expression, while about 50% of those with a peak upstream had low gene expression.

