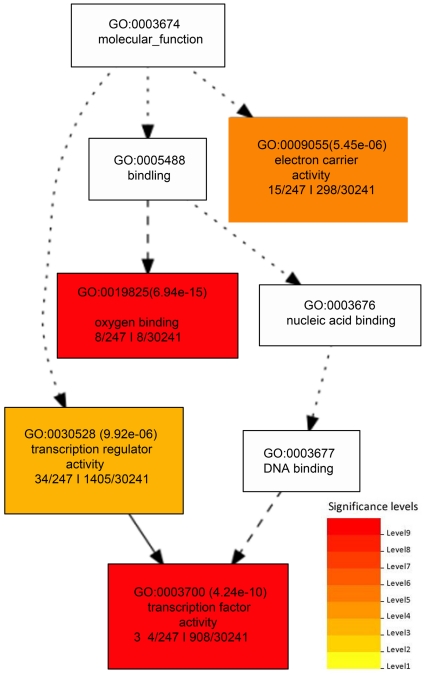
Figure 6. Enriched GO molecular functions of genes with low expression and an upstream peak.
This figure shows the significant molecular function GO annotations for genes with low gene expression and a MACS peak upstream. The notation and coloring are the same as that described in Figure 5.

