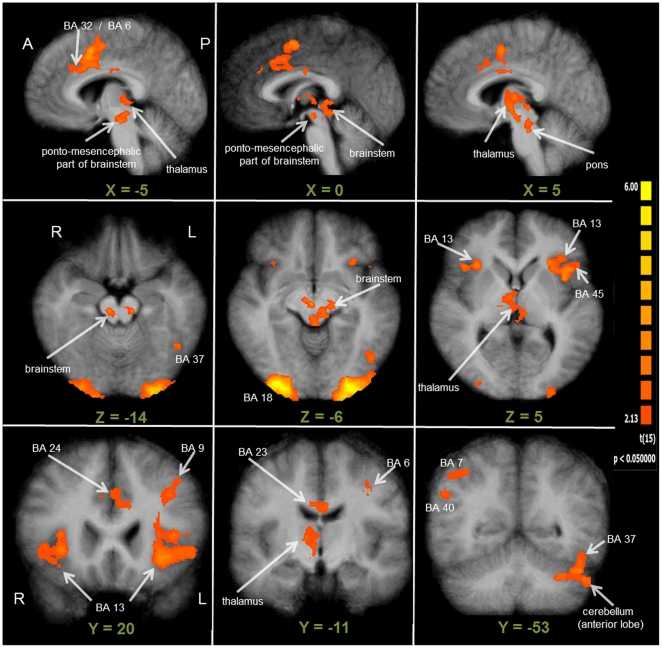
Figure 3. Whole-brain results of the first part of the fMRI analysis (RFX-GLM; n = 16).
All clusters of activation displayed here are derived from the contrast Intrinsic Alertness Task > Control Task, depicting the same contrast as in Figure 2. For better visualization, especially for subcortical and thalamic structures, this figure shows the results being projected onto the average brain of all 16 participants. At the individual voxel-level, significant activations were thresholded at p = 0.05 (uncorrected). Additionally, a cluster-size threshold of k = 34 voxels was applied, which together resulted in a cluster-level false-positive rate of 5% (whole-brain corrected p = 0.05). The first row depicts sagittal slices, covering all activations located close to the midline and the medial part of the brain. Transversal slices, covering the brainstem and the thalamus, are shown in the second row. The third row depicts three coronal slices, illustrating the frontal, parietal and thalamic activations, and the activation within the cerebellum, extending into the fusiform gyrus (BA 37). All results are shown in radiological convention. (A = anterior; BA = Brodmann area; P = posterior; R = right hemisphere; L = left hemisphere).

