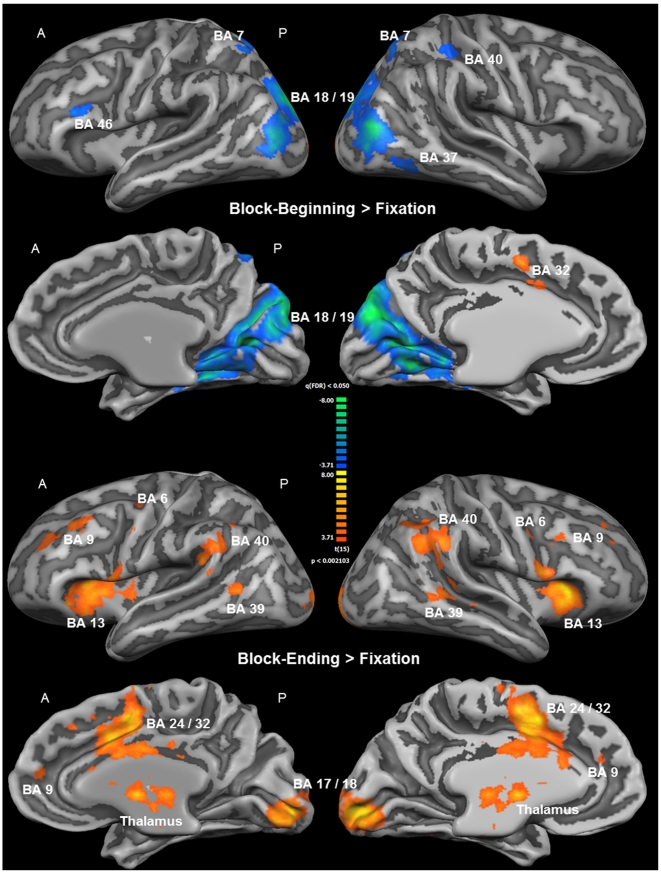
Figure 5. Whole-brain results of the second part of the fMRI analysis (RFX-GLM; n = 16).
The displayed clusters of activation result from the contrast Block-Beginning > Fixation in the upper part of the Figure, and from the contrast Block-Ending > Fixation in the lower part of the Figure. For visualization, results were projected onto the optimized 3D surface reconstruction which represents the average brain of all participants. All activations were thresholded at q(FDR) < 0.05 (t = 3.71). The beginning of the intrinsic alertness task is associated with less activation, relative to the low-level baseline (color code, blue to green), including alertness-related areas such as the right parietal cortex, and the only brain area showing increased activation (color code, orange to yellow) during this stage of the task is the ACC. The ending of the intrinsic alertness task, on the other hand, is associated with widespread activations, including the fronto-parietal intrinsic alertness network, and decreased activity was not found as a result from this contrast. For a complete list of functional activations resulting from the contrasts Block-Beginning > Fixation and Block-Ending > Fixation, see Table 2. (A = anterior; BA = Brodmann area; P = posterior).

