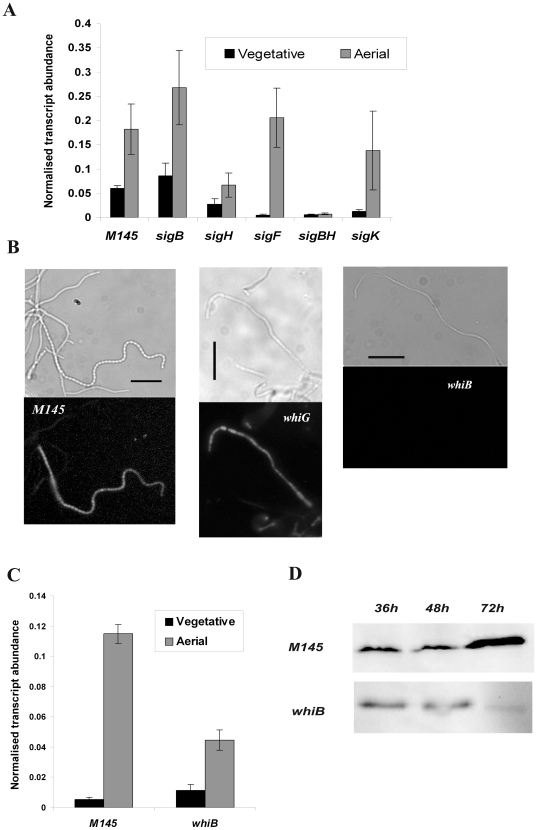
Figure 5.
Developmentally controlled expression of dpsA in S. coelicolor M145, sigB −, sigF −, sigK − and sigB/H − strains assessed by qRT PCR (A). Bright field and corresponding fluorescence image showing DpsAmCh expression in aerial hyphae of S. coelicolor M145, whiG − and whiB − strains. Bar: 10 µm (B). qRT PCR showing dpsA transcript abundance in vegetative and aerial hyphae of S. coelicolor M145 and whiB mutant. Error bars indicate standard deviation. (C). Immunoblot comparing DpsAHis abundance in S. coelicolor M145 and whiB − strain throughout the developmental life cycle. Similar amounts of total protein were loaded in each lane (D).

