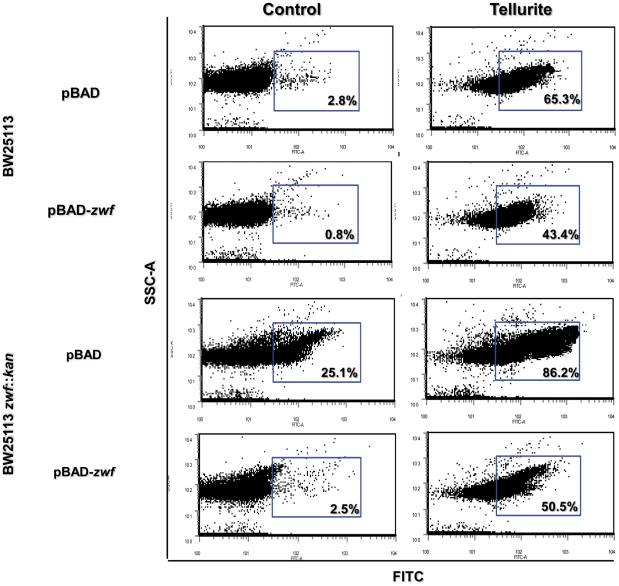
Figure 3. Effect of zwf expression on ROS content.
ROS content was assessed in the indicated strains by flow cytometry using the oxidation-sensitive probe H2DCFDA. Expression of zwf was induced in the presence of L-arabinose (0.2%). Cells were incubated for 30 min in the absence or in the presence of 2 µM tellurite, washed and incubated with 2 mM H2DCFDA for 30 min in the dark, washed again and diluted 1∶10 with PBS buffer. Fluorescence intensity was determined using a Becton Dickinson model FacsCanto II equipment equipped with an argon laser (excitation 490 nm, emission 519 nm) [45]. The per cent of cell population that was positive for fluorescence is indicated (blue rectangles). A representative dot plot of 3 independent trials is shown. FITC, fluorescence intensity; SSC-A, cell complexity.

