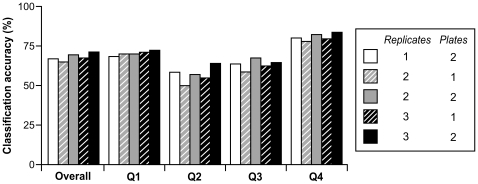
Figure 3. Classification accuracy of measurements from a single visit versus average of multiple visits.
Telomere length measurement at any single visit was estimated using a different number of technical replicates (indicated as different color bars), and compared against the “gold standard”, which was the average of telomere length measurements estimated from 6 technical replicates at multiple visits (7 visits in 24 women and 6 visits in 3 women). Women are classified into quartiles (Q1, Q2, Q3 and Q4) using the gold standard value. Individual bars for women in each quartile represent the percentage of the time women are correctly placed in the gold standard quartile using different numbers of replicates.

