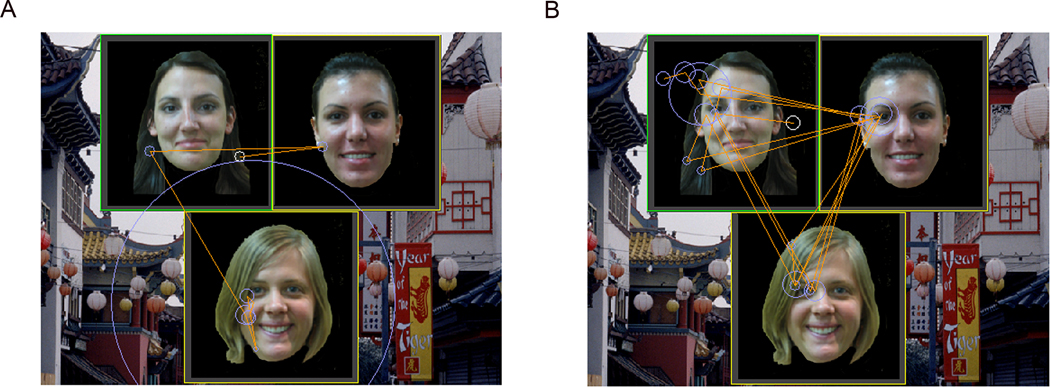
Figure 2.
Typical eye-movement behavior for Match trials in the control group (Figure 2A) and in the schizophrenia group (Figure 2B); matching face is in the bottom position
Circles indicate regions of fixation, and the radius of the circle reflects fixation duration (larger circles represent longer fixations). Solid lines represent the path of eye-movements on the display. Normal controls spend preferentially more time fixating on the matching face with limited exploration of the two non-matching faces or the background. In contrast, preferential viewing of the matching face is markedly reduced in the schizophrenia group with more transitions between the display elements.

