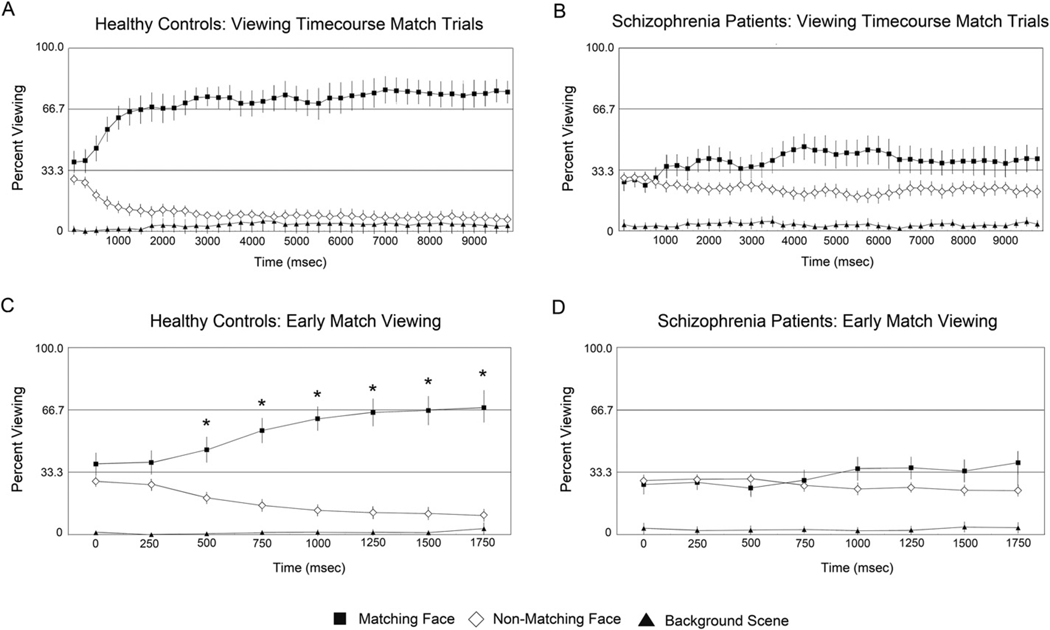
Figure 4.
Average proportion of viewing time allocated to display elements over the 10-sec test trial for control participants (Figure 4A) and schizophrenia patients (Figure 4B) as well as the first two seconds of test display viewing for controls (Figure 4C) and patients (4D)
Bars plotted around the means represent 95% confidence intervals. For C and D, starred values indicate greater than chance (33%) viewing of matching face for an individual time bin during the first two seconds of display viewing, p < 0.05, Bonferroni corrected. In the control group, preferential viewing of the matching face emerges within 500 msec after presentation of the test face triad (Figure 4C). A strong preferential viewing pattern is maintained throughout the trial, with controls spending 70–75% of total viewing time on the matching face (Figure 4A). In contrast, for the schizophrenia group viewing of the matching face never exceeds chance levels during early display viewing (Figure 4D), and is not as robust as the control participants, never exceeding 50% for any individual time bin (Figure 4B).

