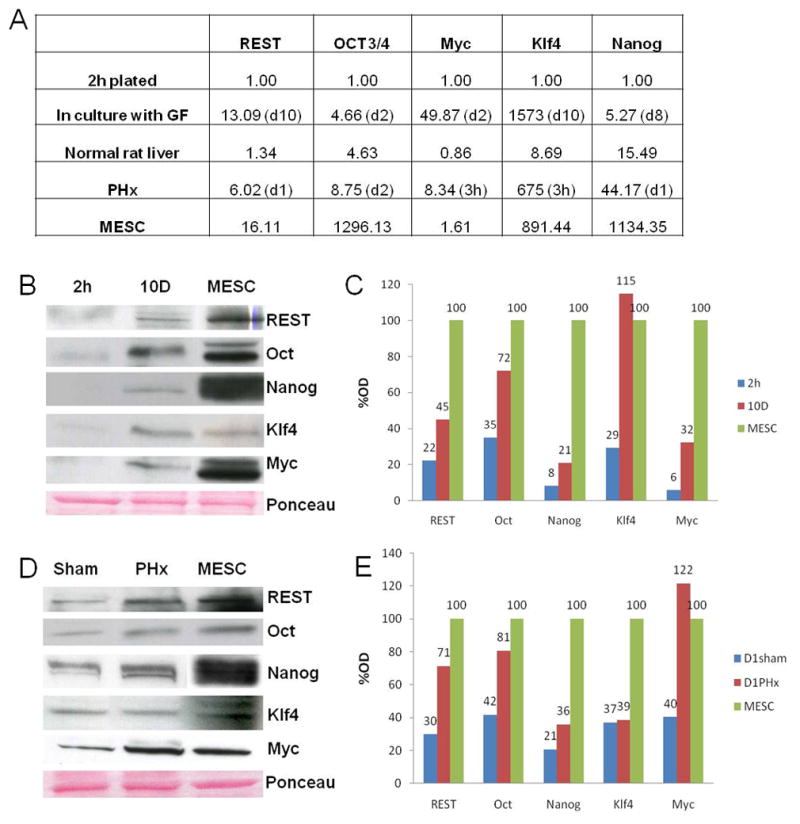
Figure 7.

Expression of reprogramming factors after 70% PHx compared to MESC. (A) Fold induction of reprogramming factors as assessed by qRT-PCR in culture and after PHx relative to MESC. (B) Western blot of reprogramming factors in culture at 2h after plating, 10 days incubated with GF, and MESC. (C) Densitometric analysis of protein in culture expressed as a percentage of MESC. (D) Western blot of reprogramming factors in sham controls, one day after PHx, and MESC. (E) Densitometric analysis of protein after PHx expressed as a percentage of MESC.
