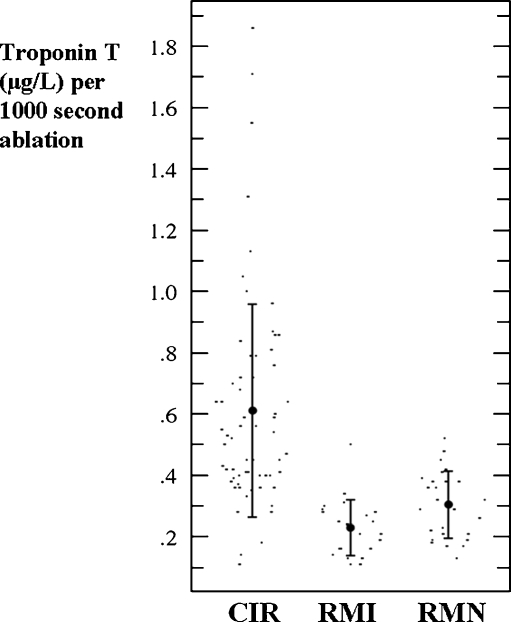
Fig. 1.
Scattergrams of ablation time-corrected serum troponin T level. Mean values with error bars of one standard deviation are shown. Note: there was a larger variance in time-corrected troponin T in the CIR group than in either the RMI or the RMN groups (p < 0.01). CIR conventional manual irrigated catheter, RMI remote magnetic irrigated catheter, RMN remote magnetic non-irrigated catheter

