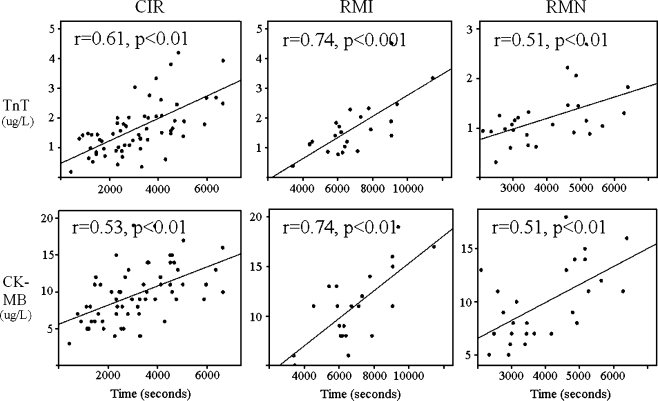
Fig. 2.
Correlation of troponin T (TnT) and cardiac creatin kinase (CKMB) with total ablation time. Upper panels, relationship between serum troponin T level and total ablation time. Lower panels, relationship between serum CKMB level and total ablation time. Plots show significant correlations between the myocardial marker levels and total ablation time in all groups. Y-axis serum levels of troponin T (micrograms per liter) or CKMB (micrograms per liter). X-axis total ablation time (seconds). CIR, RMI, RMN; see Fig. 1

