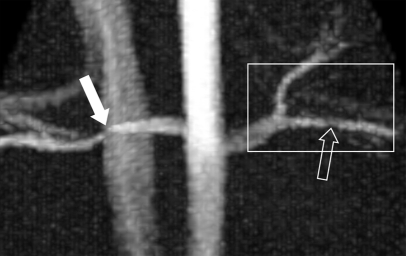
Figure 2a:
Porcine model of RAS at unenhanced phase-contrast VIPR MR angiography (pig 8). (a) Unenhanced MR angiographic image of the complex differences shows significant main RAS on the right (solid arrow). Mild to moderate stenosis in the left segmental renal artery (open arrow) is not visualized with certainty and was not identified during expert reading of the angiographic image obtained from the phase-contrast VIPR acquisition. (b) Enlarged velocity map of the left segmental renal artery shows increased flow (solid arrow) distal to the stenosis (open arrow). (c) Pressure (P) map calculated from the velocities according to the Navier-Stokes equations shows a pressure gradient across the stenosis (arrow) (Movie [online]).

