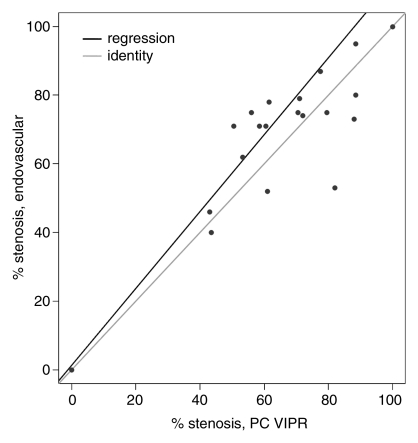
Figure 3c:
(a, b) Calibration plots of (a) mean and (b) peak TSPGs as measured noninvasively with phase-contrast (PC) VIPR and invasively with endovascular guidewires. (c) Plot of degree of stenosis measurements from phase-contrast VIPR angiograms (average of both observers) and DSA images. Gray lines = identity lines. Black lines = linear fit from the regression analysis. P = pressure.

