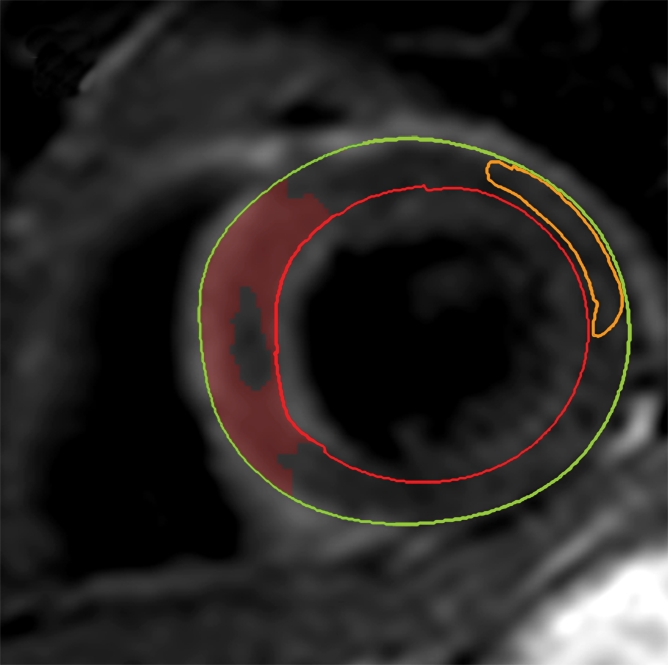
Figure 2b:

Cardiovascular MR images demonstrate identification and quantification of myocardial edema and hemorrhage with T2-weighted imaging. Green contours = LV epicardial border, red contours = LV endocardial border, orange contours = region of interest in the remote normal myocardium. (a) High signal intensity in the interventricular septum indicates myocardial edema. Area of hypointense signal in the edematous zone indicates hemorrhage. (b) Highlighted tissue is defined as myocardium with a signal intensity greater than 2 SDs of remote normal myocardium (ie, myocardial edema). (c) Yellow contour defines the edematous zone and includes the area of hemorrhage. (d) Yellow contour delineates the area of hemorrhage.
