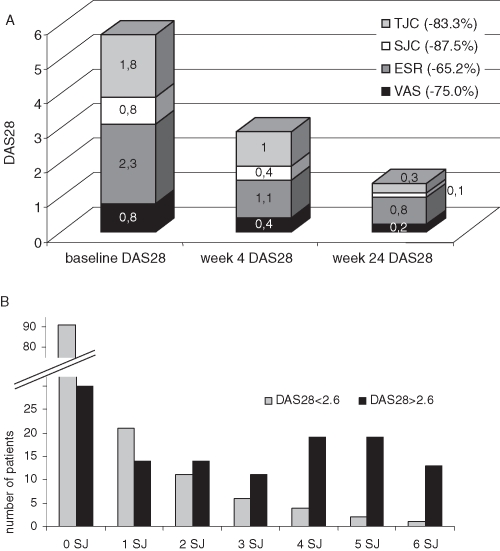
Figure 1.
(A) Twenty-eight joint count Disease Activity Score (DAS28) values of the patients reaching DAS remission at week 24. Each stacked bar represents the DAS28 value at the respective visit. Each segment of a single bar represents the proportion of DAS28 that is due to a specific core variable. In the figure it is, for example, shown that 2.3 points of a total DAS28 of 5.7 at baseline is due to erythrocyte sedimentation rate (ESR) or 0.1 points of a total DAS28 of 1.5 is due to swollen joints (SJs) after 24 weeks. The relative reduction between baseline and week 24 is highest for swollen joint count (SJC) and tender joint count (TJC) (87.5% and 83.5%) compared with reduction of the ESR (65.2%). It is obvious that the TJC and the ESR are weighted higher in the DAS composite than the SJC and the Visual Analogue Scale (VAS). (Please note: numbers in the figure were rounded incorrectly for ESR at week 4 and 24, thus resulting in slightly different numbers.) (B) Number of patients, who are in DAS28 remission (grey) or and with a DAS >2.6 (black) after 24 weeks and their number of SJs. Though most patients in DAS28 remission had no SJs, some patients still had a significant number of SJs.

