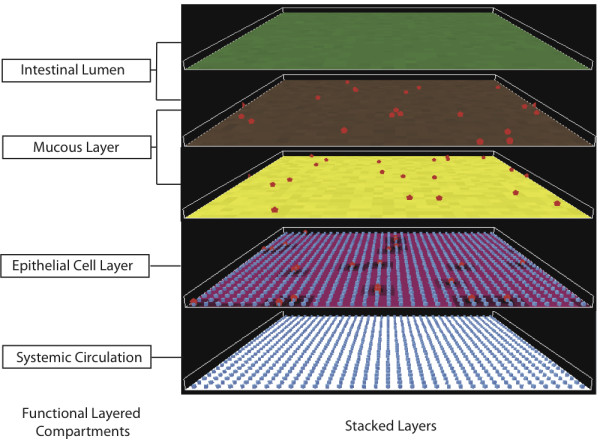
Figure 1.

Architecture and topology of the ABM. The ABM simulates the 3-dimensional relationships of the gut-luminal interface by utilizing "stacked" data layers, each one representing a two-dimensional aspect of the gut-microbial interaction environment. It should be noted that the "stacking" occurs only in a virtual sense. This approach is akin to that used in geographical information systems (GIS) [102]. Representative layers depicted include luminal phosphate concentration (green patches), endogenous gut flora population (brown patches), mucous barrier (yellow patches), and epithelial cell tight junctions (violet patches). Agents interact within and between data layers as depicted by Pseudomonas agents (red pentagons) in the mucous and epithelial layers and epithelial cell agents (blue squares) in the epithelial cell layer and interface with the systemic circulation. Simulation world data is passed from one data-layer to the next based on encoded rules in the ABM. Run-time visualization of model layers or variables can be modified at the user interface with application of filters for specific variables to be displayed in the 2-dimensional graphical interface (see Figure 2).
