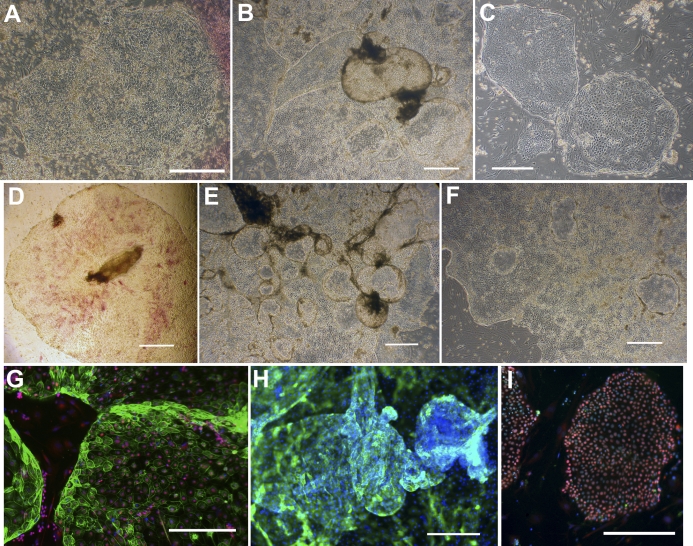
FIG. 1.
Features of iTR cell colonies are shown. A) Emerging colony on original reprogramming plate at Day 22 after viral transduction is shown. The iTR colony, which provided the iTR1 line, was broken up physically and transferred fresh MEF feeder in stem cell medium containing KOSR and FGF2 (F2 medium), i.e., regular stem cell medium. B) During culture after the second passage (p2), we noted that the colonies contained a mixture of cell types, including areas that lifted from the substratum and formed domes. Areas forming domes were roughly ovoid and consisted exclusively of epithelial sheets. C) Small iTR1 colonies contain a heterogeneous mixture of morphologically distinct cell types, including ones with an epithelial appearance. D) A larger iTR1 cell colony stained for alkaline phosphatase (AP). Although epithelial cells with larger cytoplasm were negative for AP, smaller cells are weakly positive. The colony shown had possessed a centrally placed ovoid dome that shrank and collapsed during fixation. E) If colonies are cultured beyond 10 days in F2 medium under 20% O2, iTR colonies became largely epithelial, with most of the surface covered with well-developed “dome-like” structures that give rise to floating spheres. F) In parallel experiments in which iTR cells had been generated under 4% O2 and then maintained under these conditions, iTR colonies showed a more modest development of domes (images captured at Day 14 of culture at p1). Bars = 500 μm in A–F. Immunostaining of regions of an iTR1 colony (G, H) and iPS cell colonies (line ID6 [I]) for KRT7 (green [G, H, I]) and SOX2 (red [G and I]). Nuclei have been counterstained with DAPI (blue [G, H, I]). KRT7 staining was evident in the epithelioid cells and was prominent in the outer regions of the colony (G). The domes also stained intensely for KRT7 and frequently rounded off to form floating vesicles (H). H) Focus was adjusted to the protruding tip of a dome so that the cells attached to the coverslip were out of focus. All cells in iTR and iPS colonies stained positively for SOX2, although immunostaining could not distinguish between the endogenous gene product and SOX2 expressed from the reprogramming gene (G, I). KRT7 expression was observed only in iTR cells. Bars = 200 μm in G–I.

