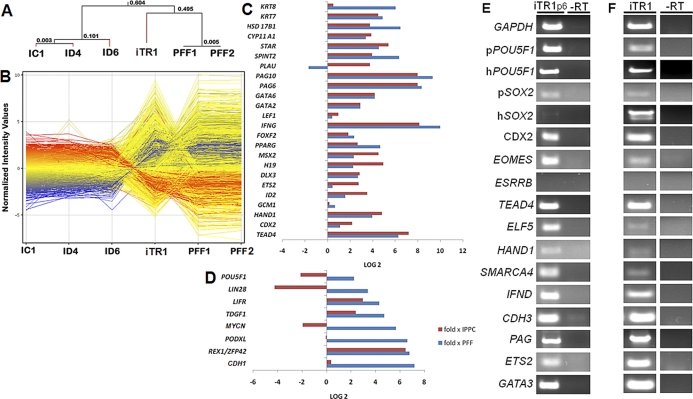
FIG. 2.
Transcriptome analysis of porcine iTR cells by microarray analysis is shown. A) Hierarchical clustering of the microarray data of iTR1 and three iPS cells (IC1, ID4, and ID6) and parental fibroblast lines (PFF) reported previously [15] show clear branching of the iTR1 line from the pluripotent iPS cell lines and the somatic cells (PFF). B) Normalized intensities of the genes reveal striking differences in gene expression of the iTR1 line in comparison to the iPS and PFF cells. Log2-fold change in TR (C) and pluripotent (D) gene expression in iTR1 cells compared to iPS cells (red bars) and PFF (blue bars). E, F) Candidate gene expression analysis of iTR1 cells and teratomas. E) Semiquantitative RT-PCR analysis was conducted for expression of selected pluripotency and TR marker genes from cells at passage (p) 6 cultured in F2 medium. The “RT” lanes indicate control reactions without reverse transcriptase. F) Similar PCR analysis of reverse transcribed RNA from a teratoma derived from iTR1 at p7 is shown.

