
Figure 1.
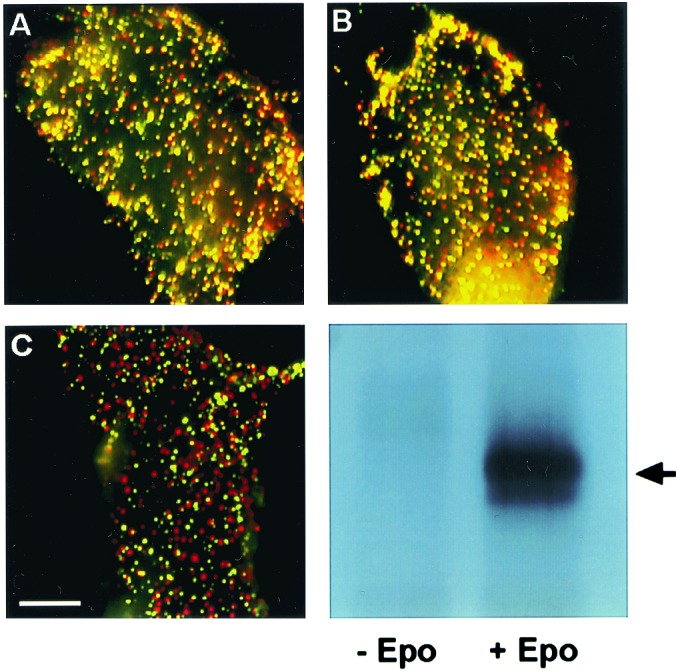
Immunofluorescence copatching to explore homomeric EpoR complexes at the cell surface. BOSC cells were cotransfected transiently with HA-EpoR plus Myc-EpoR (A and B) or with HA-EpoR plus Flag-PrlR (C). Live cells were labeled consecutively with a series of antibodies at 4°C to mediate patching and fluorescent labeling. This labeling protocol results in HA-EpoR labeled by Cy3 (red) and Myc-EpoR or Flag-EpoR labeled by FITC (green). Mutual patches containing both red- and green-labeled receptors appear yellow when the two fluorescent charge-coupled devise images are overlapped. (Bar, 20 μm.) (A) No ligand added. HA-EpoR (red) and Myc-EpoR (green) exhibit a high degree of copatching (yellow). (B) Same as A, but the cells were incubated with Epo at 100 units/ml. The ligand was added with the normal goat IgG before copatching and was retained during successive incubations. Only a minor increase in copatching is observed. (C) No ligand added. HA-EpoR (red) shows a low degree of copatching with Flag-PrlR (green), which is similar to the background level observed for HA-EpoR patching with unrelated receptors (see Fig. 2). (D) As in A, BOSC cells were transfected with EpoR cDNA cloned in pMX-IRES-GFP. At 48 h after transfection, cells were stimulated with Epo at 100 units/ml for 7 min at 37°C or left unstimulated. Cells were lysed on ice in 1% Nonidet P-40 buffer, immunoprecipitated with anti-EpoR antibodies, and analyzed by Western blotting with anti-phosphotyrosine monoclonal antibodies 4G10. The arrow indicates EpoR.