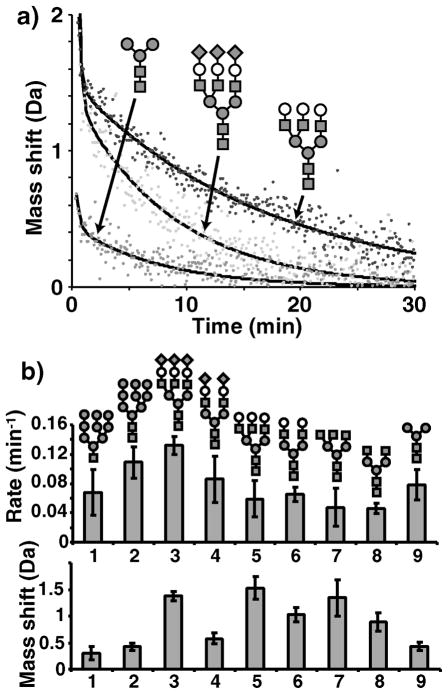
Figure 3.
Exchange rates and mass shifts for the ensemble of glycan chains. a) Mass shifts as a function of time are plotted for pentasaccharide core (dark grey), full triantennary (light grey), and asialo triantennary (black) glycans. Black lines show the double exponential fit for each species. Diagrams of each glycan are included showing GlcNAc (grey squares), mannose (grey circles), galactose (white circles), and sialic acids (diamonds). b) Exchange rates (top) and mass shifts (bottom) are shown for single core GlcNAc high mannose (1), dual core GlcNAc high mannose (2), tri-sialylated triantennary (3), bi-sialylated biantennary (4), asialo triantennary (5), asialo biantennary (6), asialo agalacto triantennary (7), asialo agalacto biantennary (8), and pentasaccharide core (9). Diagrams of each glycan above each bar are drawn as described in a).

