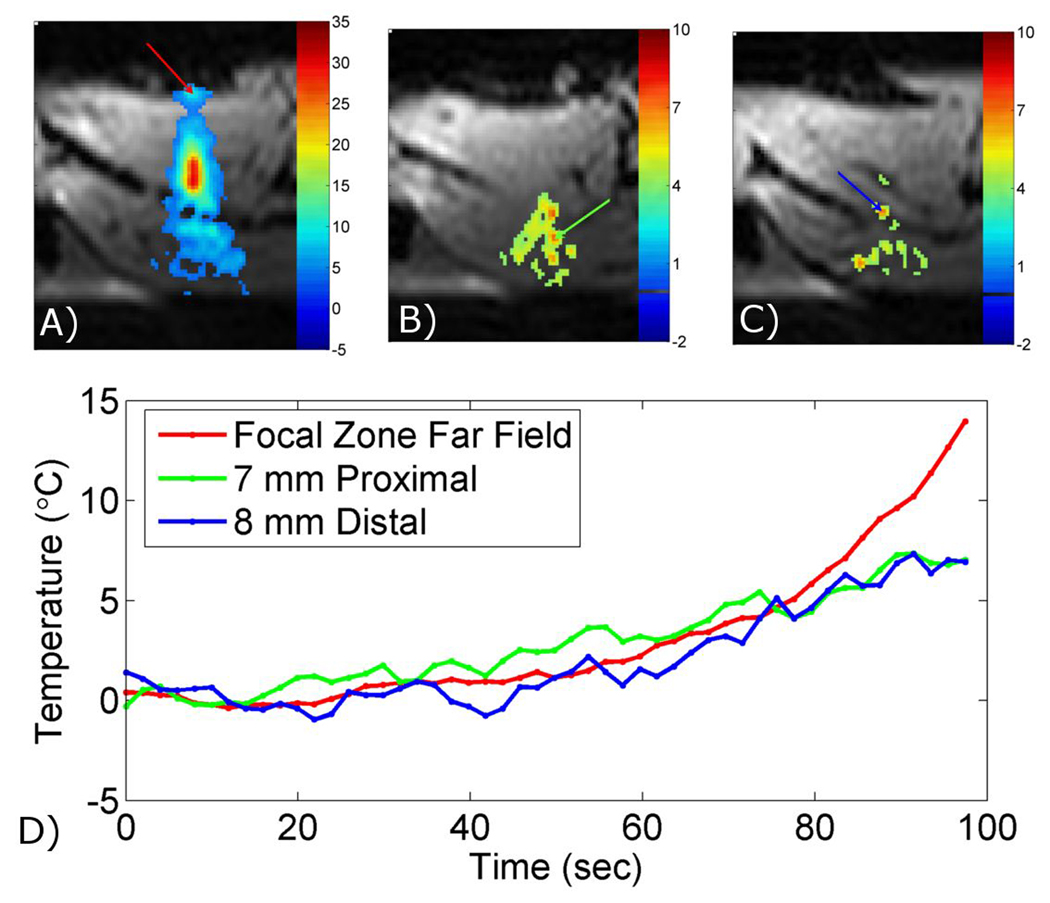
Figure 5.
Visualization of near- and far-field heating during in vivo MRgHIFU. The proposed approach is used to acquire 3-D temperature mapping during in vivo HIFU heating of a rabbit thigh muscle with 2.0×2.0×3.0 mm resolution (zero-filled to 1.0 mm isotropic spacing), 256×216×72 mm FOV, and 2.0 seconds per time frame. Images show temperature change overlaid on magnitude images. A) Transverse slice through the focal zone showing heating at a tissue/air interface in the ultrasound far field (red arrow). B) & C) Transverse slices 7 mm proximal and 8 mm distal, respectively, from the focal zone showing heating at a tissue/tissue interfaces in the ultrasound near (green and blue arrows). D) Temperature curves from the three locations shown in A), B), and C).

