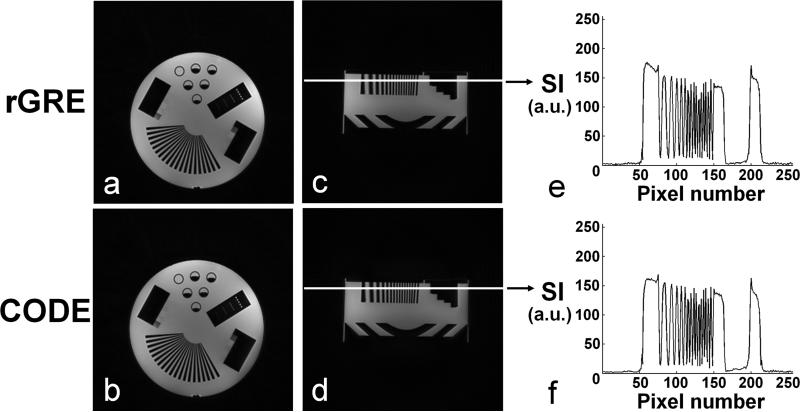
FIG. 4.
Resolution phantom images acquired using rGRE and CODE. Phantom images are shown in axial (a and b) and sagittal (c and d) planes. Signal intensity (SI) profiles are also shown along the white solid line in the sagittal images obtained with rGRE (e) and CODE (f), respectively. In all cases, flip angle = 5°, TR = 3.4 ms, and FOV (= slab width) = 30 cm. The number of projections = 128 k. Scan time = ~6 min. Isotropic resolution = 1.0 mm3. For 3D radial GRE images (a and c), a square pulse was used with Tp,square = 0.05 ms and TE = 0.22 ms. For CODE images (b and d), a sinc pulse was used with Tp,sinc = 0.1 ms and TE = 0.19 ms.

