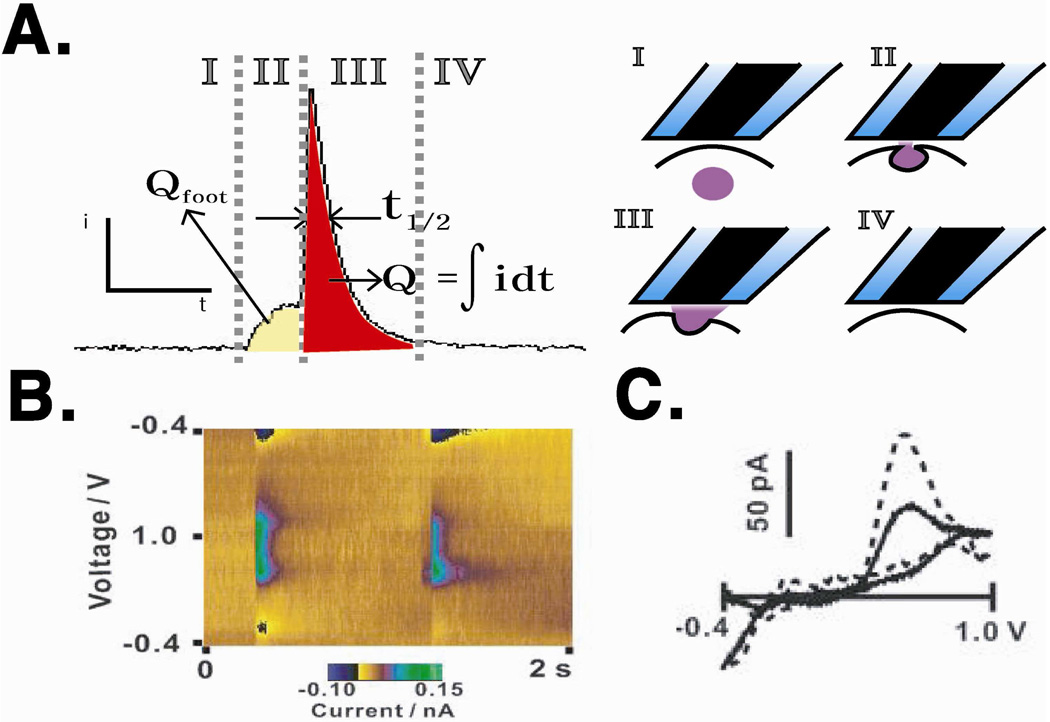
Figure 3.
(A) Correlation of spike parameters and phases of exocytosis. (B) Example false-color plot of serotonin release. (C) Voltammogram obtained from serotonin release of a single platelet (solid line) and serotonin standard solution (dotted line). Figures (B) and (C) modified with permission from American Chemical Society from Reference 25.

