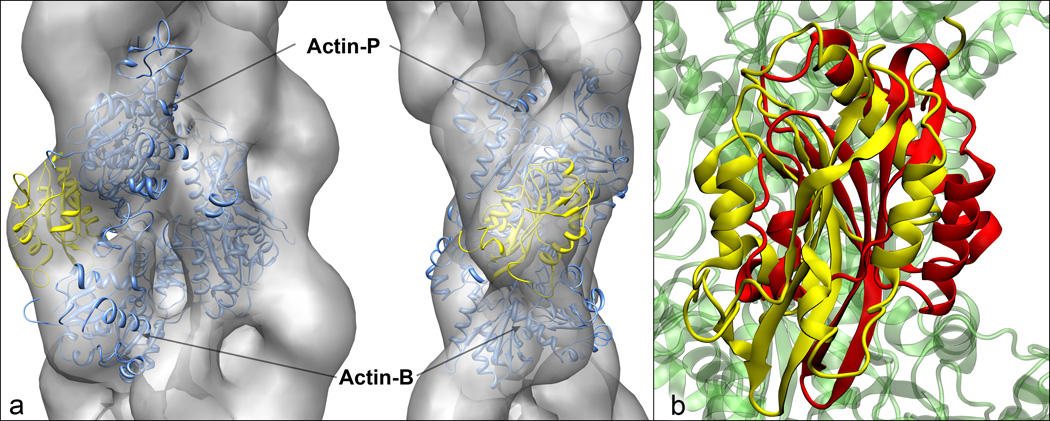
Figure 4.
Comparison of our cofilin/F-actin complex with (a) the EM volume reconstruction of Galkin et al. 25 and (b) the twinfilin/G-actin structure of Paavilainen et al.27. For the EM comparison in (a), our model depicts the actin trimer in blue and cofilin in yellow, and the position and orientation was determined by optimizing the fit between our model and the electron density map using Chimera 41. In (b), our model cofilin is shown in yellow and twinfilin in red, and the relative orientation was determined by fitting the G-actin in the twinfilin structure to our Actin-P protomer.

