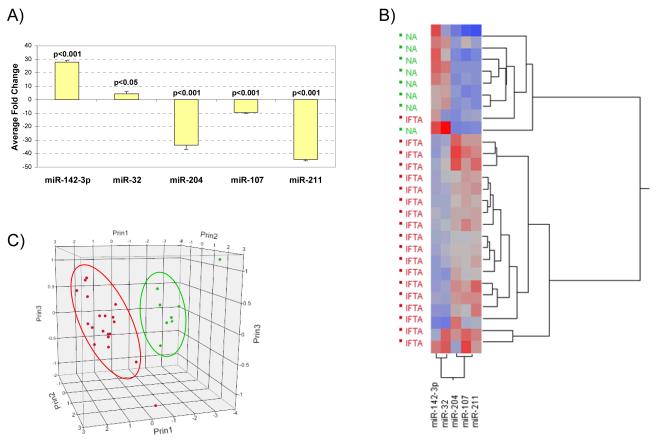
Figure 3.
(A) Taqman® MicroRNA Assays RT-qPCR results using tissue samples with histology confirmed IF/TA for 5 of the miRNAs identified in the Illumina Array study. The fold change was calculated using the ΔΔCt method. RNU48 was used as the normalizing endogenous control. (B) Unsupervised hierarchical clustering of all RT-qPCR ΔCt values using Ward’s method. Higher ΔCt values are colored red; lower values are blue. (C) Principal component analysis using the RT-qPCR ΔCt data. NA samples are colored in green; IF/TA samples in red.

