
Figure 4.
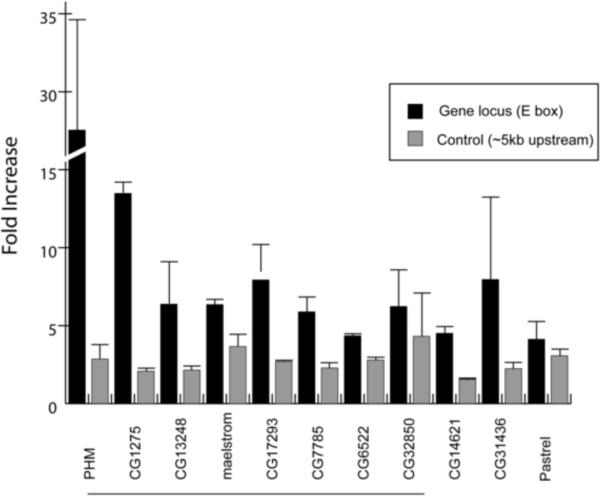
ChIP analysis in vivo of putative DIMM binding at E-boxes within dimm-dependent candidates genes.Darker histograms show the level of enrichment of the putative DIMM binding sites defined by the value in experimental versus control genotypes (see Methods). Lighter histograms show the level of enrichment of arbitrarily chosen sites ~6 kB upstream of the putative DIMM-binding sites, in the same experimental versus control genotypes. Histograms represents average and SEMs at least two independent assays (two biological replicates).