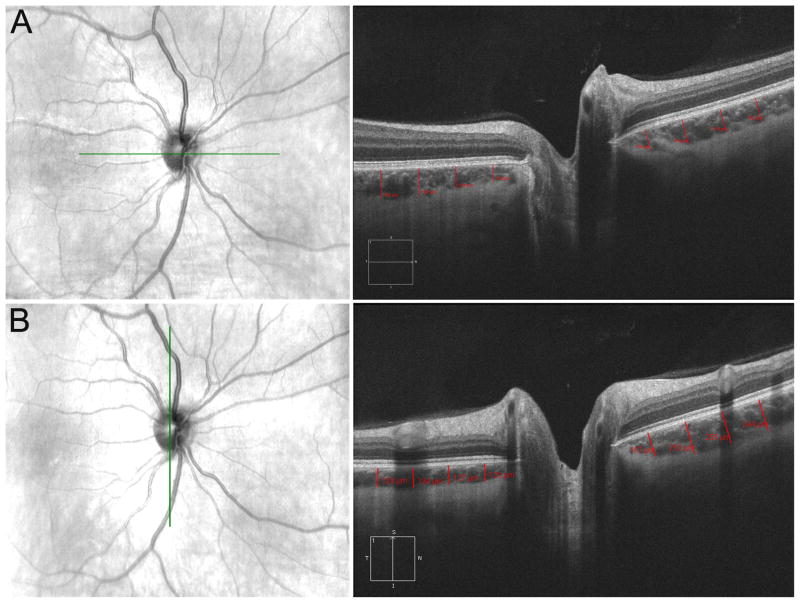
Figure 1.
Example of peripapillary choroid thickness measurements (right eye). (A) Right: Lines denote placements for the nasal (left) and temporal (right) quadrants. Left: Line denotes where scan was taken relative to the fundus. (B) Right: Lines denote placements for the superior (right) and inferior (left) quadrants. Left: Line denotes where scan was taken relative to the fundus.

