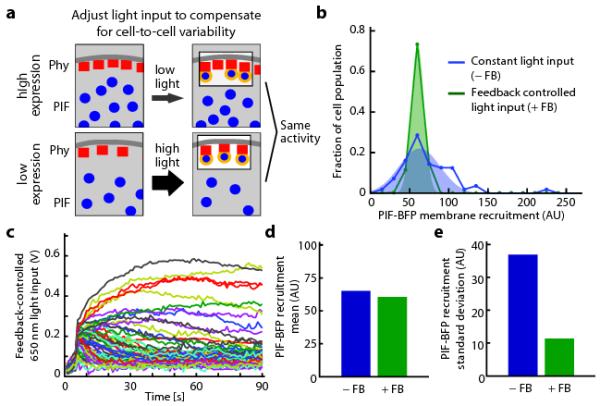
Figure 2. Feedback control can decrease cell-to-cell variability in optogenetic response.

(a) The schematic depicts that the same light input applied to cells expressing different levels of optogenetic components will lead to different activity levels. Cell-by-cell light adjustment is necessary to achieve uniform membrane-bound PIF concentrations. (b) Histograms of PIF membrane recruitment under a constant light input (0.2 V 650 nm, 0.1 V 750 nm; blue curve) and during feedback control (green curve). (c) The feedback-controlled voltages applied over time to each cell in b. The light inputs that are required to compensate for cell-cell heterogeneity span a large range of intensities. (d-e) The mean (d) and standard deviation (e) of PIF recruitment in the presence or absence of feedback control for the cell populations shown in b. AU: arbitrary units.
