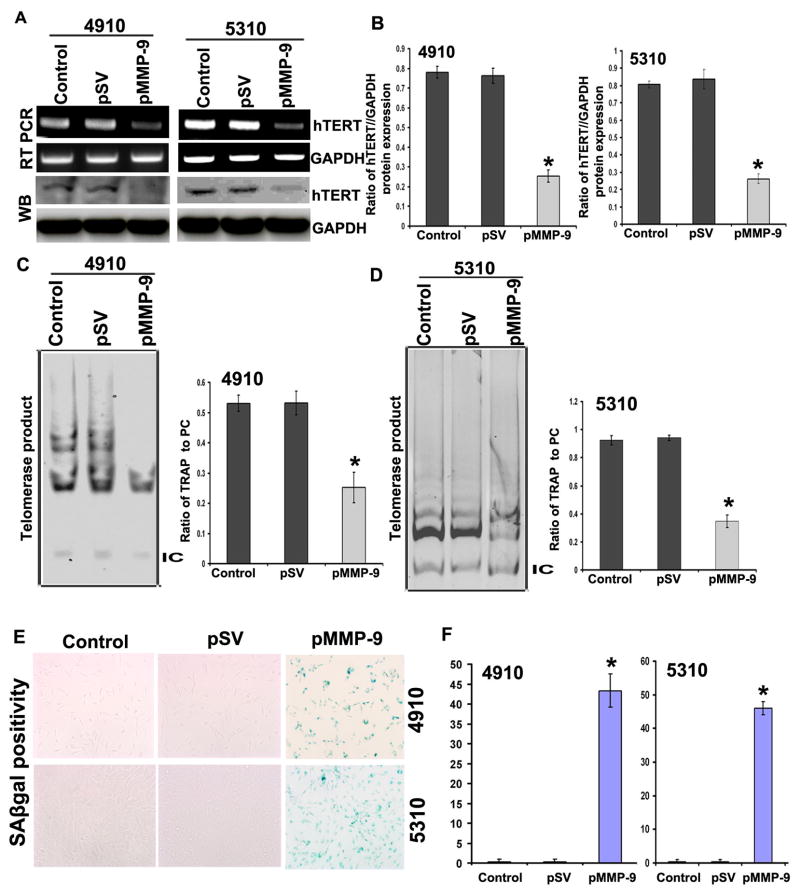
Figure 1. Effect of MMP-9 on the expression of hTERT expression and its activity.
A. RT-PCR and Western blot analysis shows effect of pMMP-9 transfection on hTERT expression in 4910 and 5310 glioma xenograft cells. B. Further, quantification of the Western blots using software to determine levels of protein after pMMP-9 treatments is shown. Values shown are the mean (±SD). *p<0.05 vs. control. (n = 3). C and D. TRAP assay was performed to evaluate the effect of pMMP-9 treatment on the activity of telomerase in both glioma cell types. 36bp band shows internal control. Bar diagram showing densitometry quantified data of TRAP product in single lane/positive control (PC) of TRAP reaction ratios from three independent experiments. IC - Internal control for TRAP reaction. Each bar represents triplicate analyses of mean ± SD. *p<0.05 vs. control. E. Senescence associated beta gal (SAβgal) staining shows effect of pMMP-9 transfection on 4910 and 5310 glioma cells in induction of senescence. Percent SAβgal positivity was calculated by scoring 200 cells from three different fields from single treatment. Mean was obtained from three independent experiments and values shown are the mean (±SD). *p<0.05 vs. control. (n=3).

