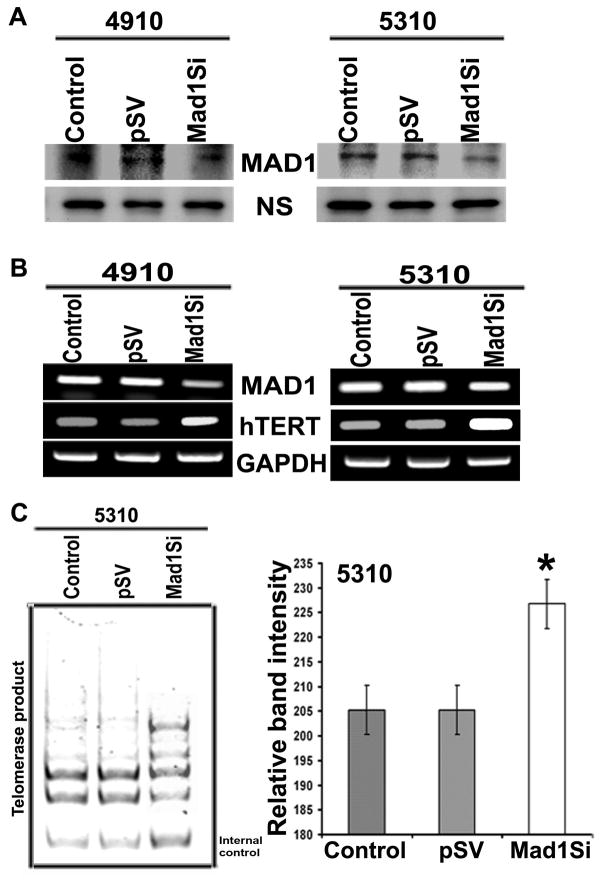
Figure 3. Effect of MAD silencing on hTERT expression in glioma cells.
A. Western blot analysis shows MAD protein expression levels after MAD siRNA treatment in 4910 and 5310 glioma cells. B. RT-PCR analysis shows expression of hTERT after MAD silencing in 4910 and 5310 glioma cells compared to pSV and control cells. C. TRAP assay was performed to evaluate the effect of MAD treatment on the activity of telomerase in 5310 glioma cells. 36bp band shows internal control.

