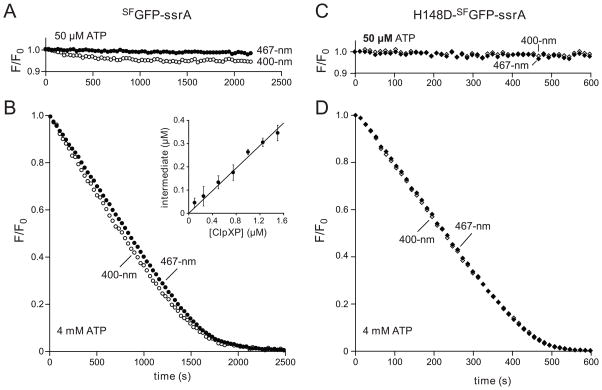
Fig. 3.
(A) Changes in 400-nm fluorescence (open circles) or 467-nm fluorescence (closed circles) following incubation of SFGFP-ssrA (10 μM) with ClpXP (1 μM ClpX6; 2 μM ClpP14) and 50 μM ATP. (B) Same proteins as in panel A but using 4 mM ATP. The inset shows the concentration of the strand-extracted intermediate after 250 s as a function of ClpXP concentration from 4 mM ATP experiments like the one in the main panel. Values plotted are averages (n=4) ± 1 standard deviation. (C) Changes in 400-nm fluorescence (open diamonds) or 467-nm fluorescence (closed diamonds) following incubation of H148D-SFGFP-ssrA (10 μM; NCBI accession code JF951865) with ClpXP (1 μM ClpX6; 2 μM ClpP14) and 50 μM ATP. (D) Same proteins as in panel B but using 4 mM ATP. An ATP-regeneration system was used in all experiments.

