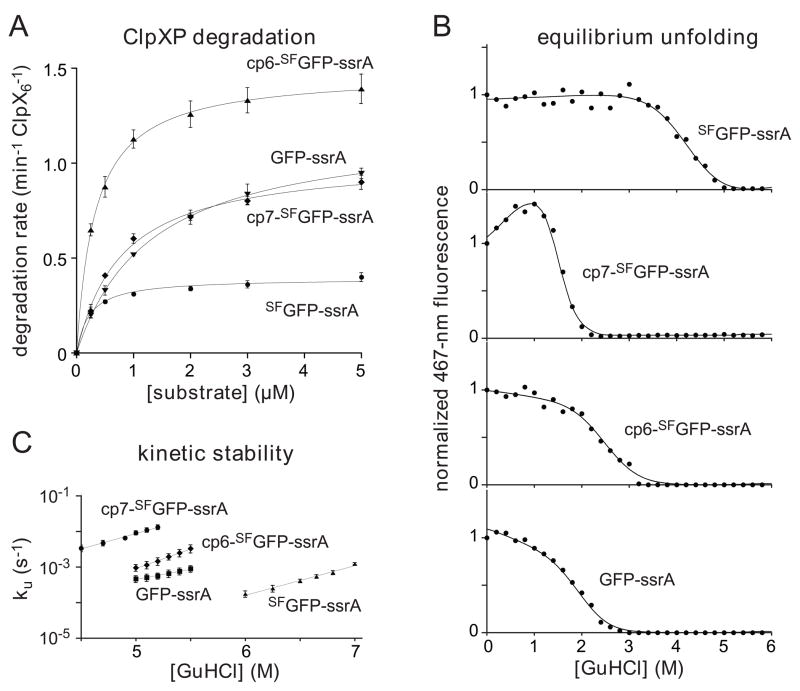
Fig. 6.
(A) Michaelis-Menten plots of ClpXP degradation (0.1 μM ClpX6; 0.2 μM ClpP14) of ssrA-tagged variants of GFP and SFGFP in the presence of 4 mM ATP and an ATP-regeneration system. Initial degradation rates were calculated from changes in 467-nm fluorescence. The lines are fits to the equation rate = Vmax•[S]/(KM + [S]). Error bars (± 1 SD) based on four independent replicates. KM and Vmax values for each substrate are listed in Table 1. (B) Proteins (0.5 μM) were incubated with different concentrations of GuHCl for 2 weeks, and denaturation was assayed by 467-nm fluorescence. The solid lines are fits to a two-state unfolding model. cp7-SFGFP-ssrA has an unusual native baseline and higher meq value than the other proteins (Table 1). These properties could reflect an increase in the solvent accessibility of the unfolded protein and/or the presence of a populated unfolding intermediate. (C) Rates constants for unfolding (ku) were determined by single-exponential fits of changes in 467-nm fluorescence after jumps to different concentrations of GuHCl. The values plotted are averages of three independent experiments ± 1 standard deviation. The final protein concentration in each assay was 0.5 μM.

