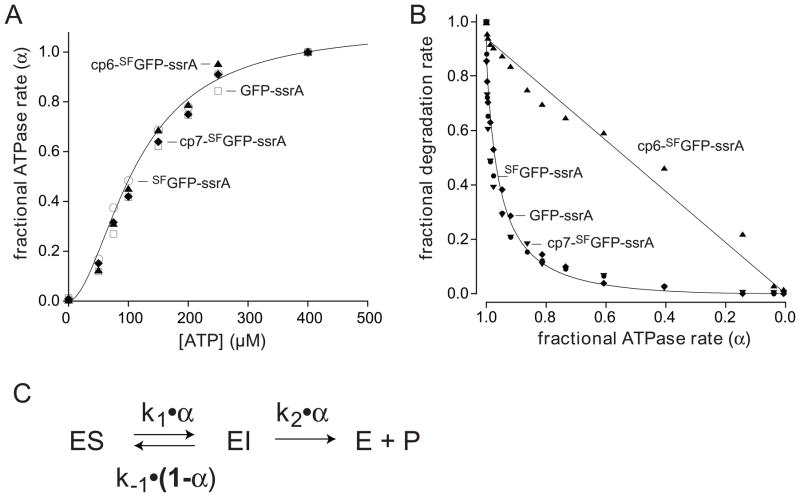
Fig. 8.
(A) Fractional rates of ATP hydrolysis (α = v/Vmax) by ClpXP (1 μM ClpX6; 2 μM ClpP14) at different concentrations of ATP in the presence of 10 μM GFP-ssrA (squares), SFGFP-ssrA (circles), cp6-SFGFP-ssrA (triangles), or cp7-SFGFP-ssrA (diamonds). The solid line is a fit of the SFGFP-ssrA data to α = 1/(1+(KM/[ATP])n), the Hill form of the Michaelis-Menten equation. KM, Vmax, and n values for each protein substrate are listed in Table 1. (B) Fractional degradation rates (v/Vmax) for ClpXP (1 μM ClpX6; 2 μM ClpP14) proteolysis of 10 μM GFP-ssrA (diamonds), SFGFP-ssrA (closed circles), cp6-SFGFP-ssrA (triangles), and cp7-SFGFP-ssrA (downward triangles) are plotted as a function of the fractional rate of ATP hydrolysis (α). Solid lines are fits to the equation ka•α2/(kb•(1−α)+α) for GFP-ssrA and cp6-SFGFP-ssrA, where ka = k1k2/(k1+k2) and kb = k-1/(k1+k2). (C) Single-intermediate model for enzymatic unfolding, where ES represents the complex of ClpXP with intact GFP and EI represents a complex in which the terminal β strand of the substrate has been extracted, leaving a 10-stranded β barrel.

