
Figure 3.
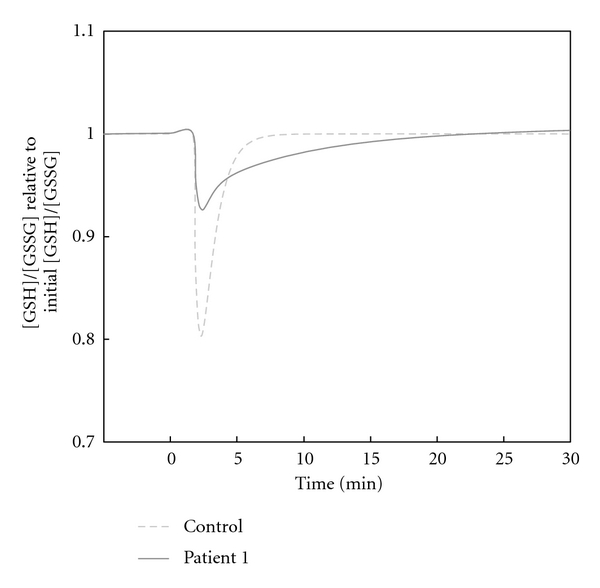
Comparison of the behavior of GSH/GSSG in the healthy control and patient 1 during H2O2 perturbation. 0.1 mM of H2O2 was added at 0 min, and the simulation was run for approximately 30 min. The y-axis represents the ratio of [GSH]/[GSSG] relative to the initial ratio, which is set as 1.0. The figure compares the healthy subject with the patient with the longest recovery time in the set of patients (i.e., patient 1).