
Figure 5.
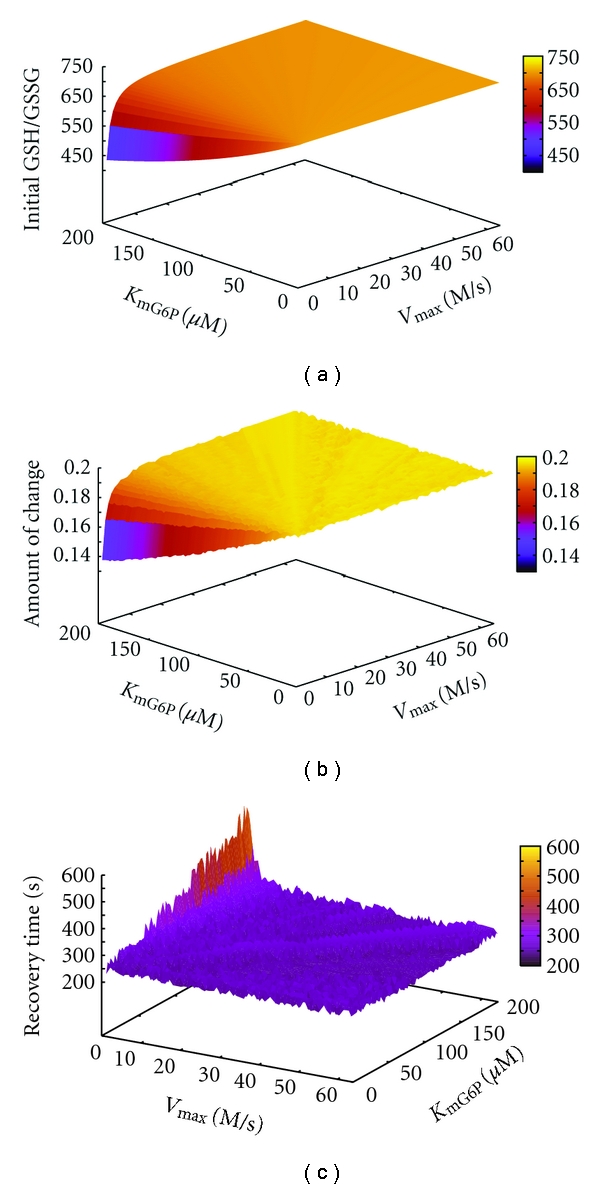
Correlation analysis of patient V max, K mG6P, and GSH/GSSG behavior. The figure shows GSH/GSSG behavior under fixed values for K mNADP, K iNADPH, K iATP, K i2,3BPG, and independent variables for V max and K mG6P. V max values within the range 0–64, and even values of K mG6P within the range 0–200, were plotted against initial GSH/GSSG (left panel), recovery time (middle panel), and amount of change (right panel).