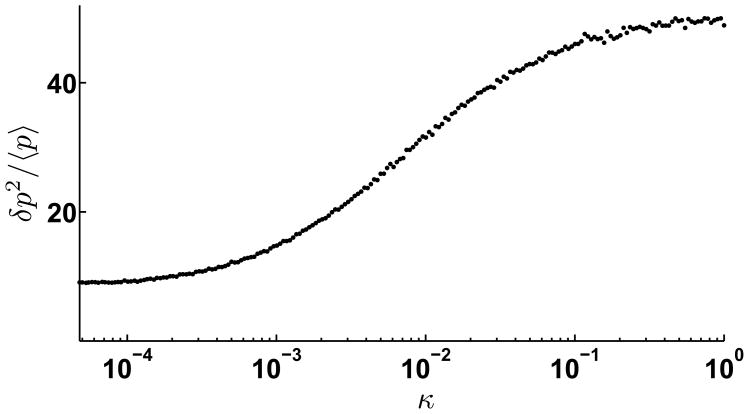
Figure 6. Expression variability increases with negative feedback strength.
Fano factor of TF numbers is plotted versus the strength of bimolecular miRNA-mRNA association rate, κ for sequestration model. The transcription rate, αm = 1.2, at the cross-over point in Figure 3. Other parameters were set at γm = γμ = 0.01, γp = 0.001, σ = 1.0, kp = 0.1, kd = 100.0. For κ =0, there is no miRNA-mediated translational repression, and Fano factor is the lowest. The Fano factor increases with κ, until it reaches a saturating value.

