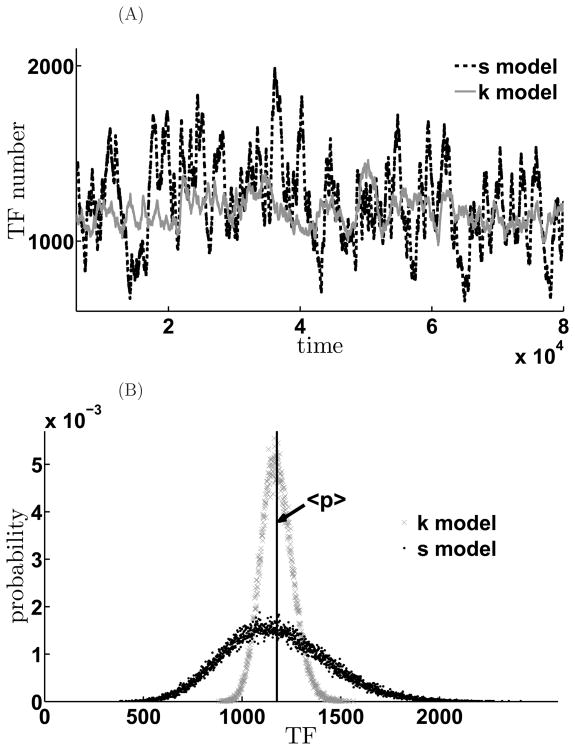
Figure 9. Expression variability depends on the mode of translational repression by miRNA.
Comparison of the different effects on the noise of the two negative feedback schemes. A. Time evolution of the mean TF values for sequestration (black curves) and kinetic suppression model (gray). B. Histogram of the steady state TF distribution for the sequestration model (black) and for the kinetic suppression model (gray). The parameters are αm = 1.1, γm = γμ = 0.01, γp = 0.001, σ = 1.0, kp = 0.1, kd = 100.0, κ = 1.0, β = 0.00087. κ and β are chosen so that their mean TF values are almost the same in both models. In the sequestration model, < p >= 1174.6, , However, in the kinetic suppression model, < p >= 1176.2, . Thus, in K model, both signal and noise are suppressed; while in S model, signal is suppressed, however, noise are amplified.

