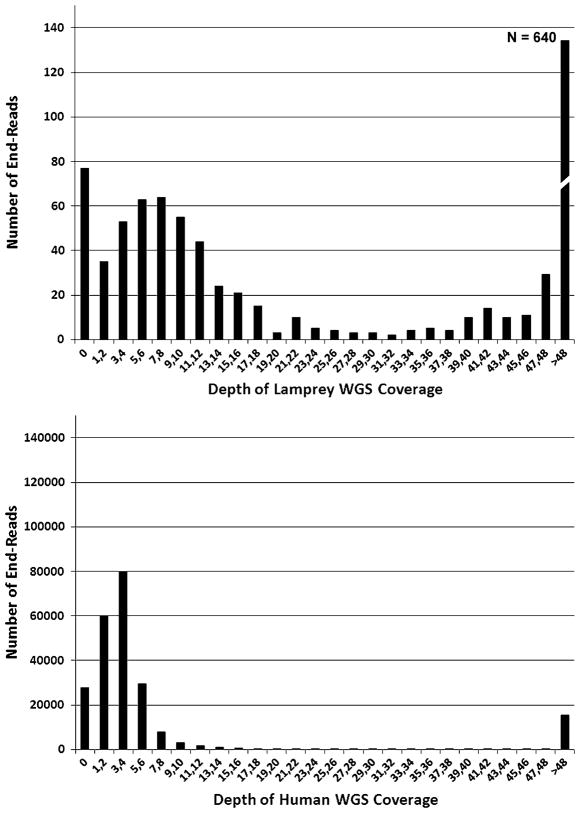
Fig. 2.
Frequency distributions for alignment coverage depths of BAC-end sequences that were aligned to whole genome shotgun sequences datasets from the same species. The height of each bar represents the number of BAC-end reads that had a given range of coverage depths. The data that are presented here consider only those BACs that yielded >400 bp of Q20 sequence for both end reads. Low-copy (approximately single-copy) end reads fall within bell-shaped distributions with modal coverage depths <30

