
Figure 2.
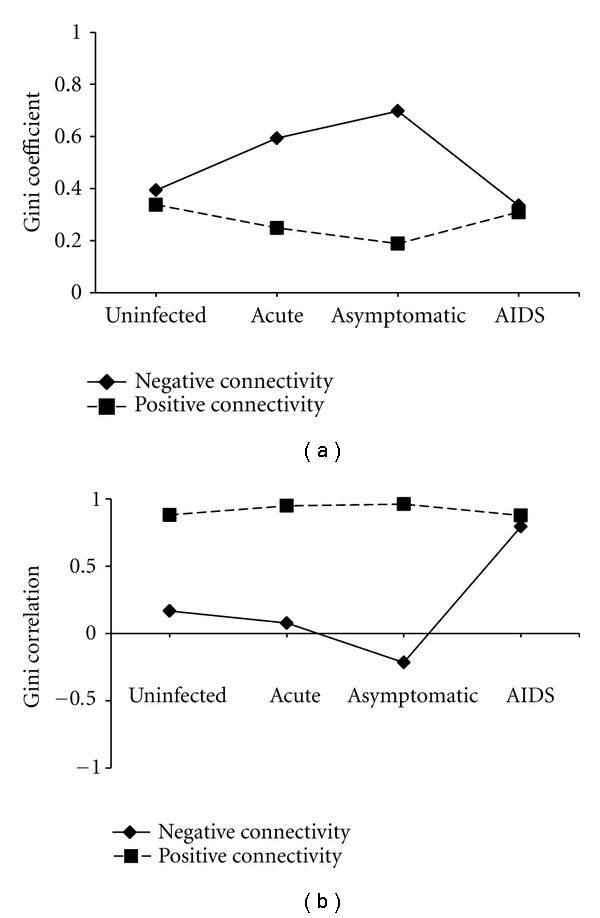
The Gini coefficients and Gini correlations of positive and negative connectivity in GCNs of the uninfected subjects and HIV-1 patients at three different stages (acute, asymptomatic, and AIDS).
Official websites use .gov
A
.gov website belongs to an official
government organization in the United States.
Secure .gov websites use HTTPS
A lock (
) or https:// means you've safely
connected to the .gov website. Share sensitive
information only on official, secure websites.
The Gini coefficients and Gini correlations of positive and negative connectivity in GCNs of the uninfected subjects and HIV-1 patients at three different stages (acute, asymptomatic, and AIDS).